Australian Immigration Statistics: 11 Years of Official Data
Migratio Editorial · Last updated
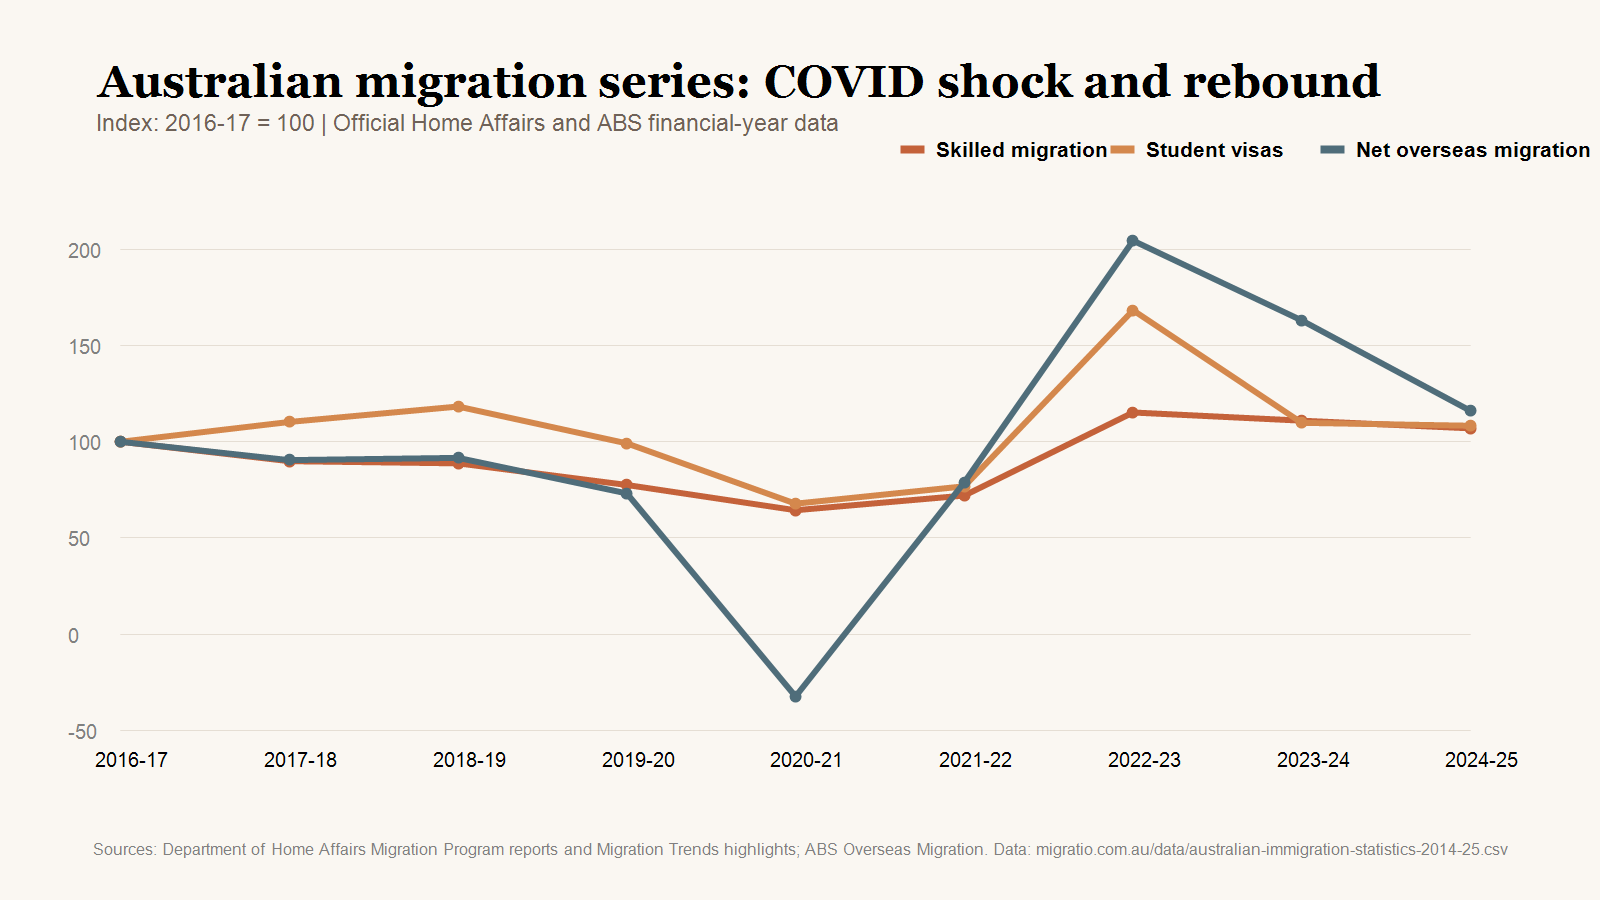
TL;DR: Compiled from Home Affairs Migration Program reports and ABS overseas migration data, 2014-15 to 2024-25: skilled visa grants hit a COVID trough of 79,620 in 2020-21 and recovered to 132,148 by 2024-25; student grants peaked at a record 577,295 in 2022-23; net overseas migration swung from a net loss of 84,940 in 2020-21 to a record 538,340 in 2022-23; and India is Australia's largest source of permanent migrants every year since 2019-20, reaching 48,326 grants in 2024-25.
This page consolidates Australia's key immigration statistics from official sources — Department of Home Affairs Migration Program reports and Migration Trends highlights (2014-15 to 2024-25) and ABS overseas migration estimates — plus Migratio's original analysis of the full register of MARA migration agents. Every figure below is reconciled against the published source documents; we deliberately exclude estimates, projections and unverifiable round numbers. Journalists, researchers and students are welcome to cite this page with attribution. For the same dataset as an interactive visualisation, see Migratio's Migration Flows globe.
Data and media downloads
Journalists, researchers and students may download and cite these aggregate files with attribution to Migratio. Media enquiries: will@migratio.com.au.
Skilled migration: from COVID trough to 132,148 grants
Skilled visa grants (covering subclasses including 189, 190, 491, 494, 186, 482, 485 and 858) ran between 109,713 and 128,550 a year through the late 2010s, then fell through COVID to a low of 79,620 in 2020-21. The rebound was sharp: 142,344 grants in 2022-23 — the highest in the eleven-year series — easing to 137,100 in 2023-24 and 132,148 in 2024-25. The 2024-25 figure sits slightly above the pre-COVID norm, meaning skilled migration has fully recovered its volume even as the visa mix within it has shifted.
Family migration: steady at around 52,500 — with one COVID anomaly
Family stream grants (dominated by partner visas) declined gently from 61,085 in 2014-15 to about 50,000-52,000 a year from 2017-18 onward. The striking exception is 2020-21, when grants jumped to 80,378 — with borders closed, processing capacity was directed at the large onshore partner-visa backlog, producing the biggest family-stream year in the series. Grants returned to trend immediately afterwards: 54,294 in 2021-22 and 52,500 in each of the three most recent years. Humanitarian grants followed a different COVID path, collapsing to 5,947 in 2020-21 before recovering to 20,000 in 2023-24 and 2024-25.
Student visas: a record 577,295 grants in 2022-23
Student visa grants ran at 343,035 in 2016-17, 378,292 in 2017-18 and 405,742 in 2018-19, fell to a COVID floor of 232,750 in 2020-21, then exploded to 577,295 in 2022-23 — the largest student visa year on record, driven by the post-reopening surge of deferred and returning students. The two most recent years show the correction: 376,731 grants in 2023-24 and 371,564 in 2024-25, back in line with the immediate pre-COVID trajectory.
Visitor visas: a 97% collapse and full recovery
No category shows the COVID shock like visitor visas. Grants peaked at 5,686,318 in 2018-19, then collapsed to 167,576 in 2020-21 — a fall of more than 97%. Recovery took three years: 1,131,890 in 2021-22, 3,818,495 in 2022-23, 4,713,442 in 2023-24 and 4,915,854 in 2024-25, still slightly below the 2018-19 peak. Working holiday maker visas tell a happier story: from a low of 39,586 in 2020-21 they reached 321,116 in 2024-25 — the highest figure in the eleven-year series, well above the roughly 210,000-a-year pre-COVID norm.
Where Australia's permanent migrants come from
Home Affairs publishes permanent Migration Program outcomes by citizenship from 2019-20. India has been the largest source country in every year of that coverage, and the gap is widening: 25,698 grants in 2019-20 rising to 48,326 in 2024-25 — nearly double. The full 2024-25 top ten: India (48,326), China (20,405), Philippines (10,972), United Kingdom (10,205), Pakistan (9,557), Sri Lanka (9,444), Nepal (8,319), Vietnam (5,665), South Africa (4,137) and Afghanistan (3,474). The notable trend beneath the headline is the rise of South Asia beyond India — Pakistan, Sri Lanka and Nepal together accounted for over 27,000 permanent grants in 2024-25.
Net overseas migration: from minus 84,940 to a record 538,340 in two years
ABS net overseas migration (NOM) — arrivals minus departures, across all visa types and citizens — ran between 184,030 and 263,350 a year through the 2010s. In 2020-21 it went negative for the only time in the series: a net loss of 84,940 people while borders were closed. The reopening produced the sharpest swing in Australian migration history: NOM of 207,910 in 2021-22, then a record 538,340 in 2022-23 as deferred arrivals, returning students and backlogged visa holders landed in a single year. It has fallen in each year since — 429,160 in 2023-24 and 305,570 in 2024-25 — but remains above the pre-COVID norm.
The migration advice industry: 5,489 registered agents
From Migratio's analysis of the full OMARA register (June 2026): Australia has 5,489 currently registered migration agents. New registrations collapsed roughly 85% after the 2018 entry-requirement changes — from 417 new agents in 2018 to just 62 in 2020 — and only recovered to a decade-high 457 in 2025. The median agent has been registered 10 years. Victoria hosts more agents than any other state (1,244, ahead of New South Wales on 1,087), and about half of all registered agents have no website. The full analysis, including registration-year methodology, is in The State of Australian Migration Agents 2026.
Sources and how to cite
Program grant figures: Department of Home Affairs Migration Program Reports (2014-15 to 2024-25) and Migration Trends Highlights, homeaffairs.gov.au. Net overseas migration: ABS Overseas Migration (cat. 3412.0), abs.gov.au. Country-level permanent program outcomes: Home Affairs Table 1.4.2 (coverage from 2019-20). Agent industry figures: Migratio analysis of the public OMARA register, June 2026. Suggested citation: Migratio (2026), Australian Immigration Statistics, migratio.com.au/blog/australian-immigration-statistics. Figures are financial-year (July-June) totals. Where a figure is unavailable in the source documents it is omitted rather than estimated.
Frequently asked questions
How many skilled visas does Australia grant per year?
132,148 skilled visa grants in 2024-25, per Home Affairs program data. That's close to the pre-COVID norm (109,000-128,000 a year through the late 2010s) and down from the post-reopening peak of 142,344 in 2022-23.
What is Australia's biggest source country for migrants?
India, in every year since country-level permanent program data begins (2019-20). Indian citizens received 48,326 permanent Migration Program grants in 2024-25 — more than double second-placed China on 20,405.
What is Australia's net overseas migration right now?
305,570 for 2024-25, per ABS estimates — down from the record 538,340 in 2022-23 but still above the pre-COVID range of roughly 184,000-263,000 a year.
How many registered migration agents are there in Australia?
5,489 agents hold current MARA registration as of June 2026, per Migratio's analysis of the public OMARA register. Victoria has the most (1,244), and the median agent has been registered for 10 years.
Can I cite these statistics?
Yes — journalists, researchers and students are welcome to cite this page with attribution to Migratio and the underlying sources (Department of Home Affairs and the ABS). The agent-industry figures are Migratio's original analysis of the public OMARA register.
Compare MARA-registered migration agents — free
Related: The State of Australian Migration Agents in 2026 · How to Choose a Migration Agent in Australia · How Much Does a Migration Agent Cost in Australia? · Do I Need a Migration Agent for My Visa Application?