Migratio / Media resources
Australian migration data press kit
Charts, clean data, source notes and attributable findings for journalists and researchers. Last checked 2 August 2026.
Migration agent enforcement and sanctions
- 61 registered migration agents sanctioned since 2021-22 — and the government's figure reconciles exactly to its own annual reports: 13 + 4 + 10 + 20 + 14.
- Sanctions rose from 4 in 2022-23 to 20 in 2024-25. OMARA attributes the rise to expanded investigative resources.
- Cancellation is the most common outcome — 38% of the 47 sanctions across 2021-22 to 2024-25, ahead of suspension (26%), barring (19%) and caution (17%).
- Against a register of 5,337 agents at 30 June 2025, the 20 sanctions represent about 0.37% of the profession, or roughly one in 314 excluding barrings.
- OMARA's six-monthly Migration Agent Activity Report — the publication designed to document all of this — has not appeared since the period ending June 2024, roughly two years overdue.
- Sanction decisions are searchable one at a time but have no export, no API and no MARN-keyed URL, so they cannot be joined to the public register at scale.
Read and cite the study
Download the sanctions-by-year CSV
Download the register-size series CSV
OMARA disciplinary decisions search
Three traps in this data. The 14 for 2025-26 is a part year, to 17 March 2026 — not a completed financial year. The 2022-23 low of 4 is partly a methodology artefact: OMARA introduced a triage model routing less serious matters to early resolution, so a 4→20 "fivefold surge" overstates the change. And OMARA publishes two different sanction numbers — 60 complaints resulted in a sanction decision in 2024-25, while 20 people were sanctioned; the 61 is on the people basis. Separately, registered agents sanctioned by OMARA and unregistered "scam agents" pursued by the Australian Border Force are legally distinct populations under different authorities, and their counts must never be combined.
Citation: Migratio (2026), Who Actually Gets Sanctioned: Five Years of Migration Agent Enforcement, https://migratio.com.au/blog/omara-migration-agent-sanctions-data
Visa processing times
- A Student (500) Higher Education visa has a median processing time of 16 days and a 90th-percentile time of seven months — a thirteen-fold gap within one stream.
- Of temporary visa applications lodged in 2024-25, 97.6% were finalised by 30 June 2025. Of permanent applications, 53.4% were.
- Skills in Demand Core Skills is running at an 83-day median against a government commitment of 21 business days for decision-ready applications.
- Computer-assisted decisions accounted for 60.7% of visa finalisations in 2024-25, up 1.91 percentage points. They are confined to low-risk grants; refusals are never automated.
- Temporary and provisional Partner applications on hand reached 96,839 at 30 June 2025, up from 75,060 a year earlier.
- Home Affairs publishes no historical processing-time series. As at 2 August 2026 the current snapshot was roughly two months behind its own stated monthly cadence.
Read and cite the study
Download the full 76-row snapshot CSV
Home Affairs global visa processing times
Traps worth knowing before you quote these. Subclass 189 has two streams: Points-Tested at 6 months, and a legacy New Zealand stream at 53 months — "the 189 takes 53 months" would be wrong. Subclass 482's "Nomination" and "Sponsorship" rows are employer-side stages, not visa streams. Subclasses 820 and 801 are two stages of one partner application measured on different clocks, so they cannot be added. The percentiles describe decided applications, not the queue, so long-pending cases are absent until they are decided. Migratio captures the dataset monthly and can supply any individual snapshot on request.
Citation: Migratio (2026), Australian Visa Processing Times: What the Published Numbers Hide, https://migratio.com.au/blog/australian-visa-processing-times-tracked
Migration Program: planned versus delivered
- In 2018-19 the program delivered 160,323 places against a planning level of 190,000 — a shortfall of 29,677 places, or 15.6%.
- The last three completed years delivered 195,004, 190,000 and 185,001 places against levels of 195,000, 190,000 and 185,000.
- Partner visas fell 16,012 places short in 2021-22: 62,300 planned, 46,288 delivered.
- Global Talent delivered 9,584 places against 15,000 planned in 2020-21, a 36% shortfall.
- The 2026-27 Regional allocation was cut 57.2%, from 33,000 places to 14,110 — the largest single reallocation in the program, and the only major change Home Affairs published no rationale for.
- 129,590 of the 185,000 places in 2026-27 are allocated to applicants already living in Australia.
Read and cite the study
Download the year-by-year CSV
Download the category-level CSV (2020-21 to 2022-23)
Download the 2026-27 planning levels CSV
Download definitions and source notes
Home Affairs Migration Program Reports
Read this before quoting the shortfalls. From 2015 the planning level was treated as a ceiling rather than a target — the Parliamentary Library records that "since 2015, the government has considered the Migration Program planning level as a 'ceiling' rather than a 'target'". Under a ceiling regime, delivering under is compliance, not failure, so pre-2022 and post-2022 figures are not the same kind of measure. The Child stream also moved into the Family stream in 2022-23, so Family totals are not like-for-like across that year. The 2025-26 outcome is not yet published; any 2025-26 figure in circulation is an estimate.
Citation: Migratio (2026), Australia's Migration Program: Planned Versus Delivered, 2015-16 to 2024-25, https://migratio.com.au/blog/migration-program-planned-vs-delivered
The migration-agent profession
- New registrations fell 85.1%, from 417 in 2018 to 62 in 2020, then reached 457 in 2025.
- 2,727 of 5,489 agents had no working website listed, equal to 49.7% of the fixed June 2026 snapshot.
- Victoria had 1,244 listed agents, 14.4% more than New South Wales.
Read and cite the study
Download the aggregate CSV
Download the 1600 x 900 chart
Check the official OMARA register
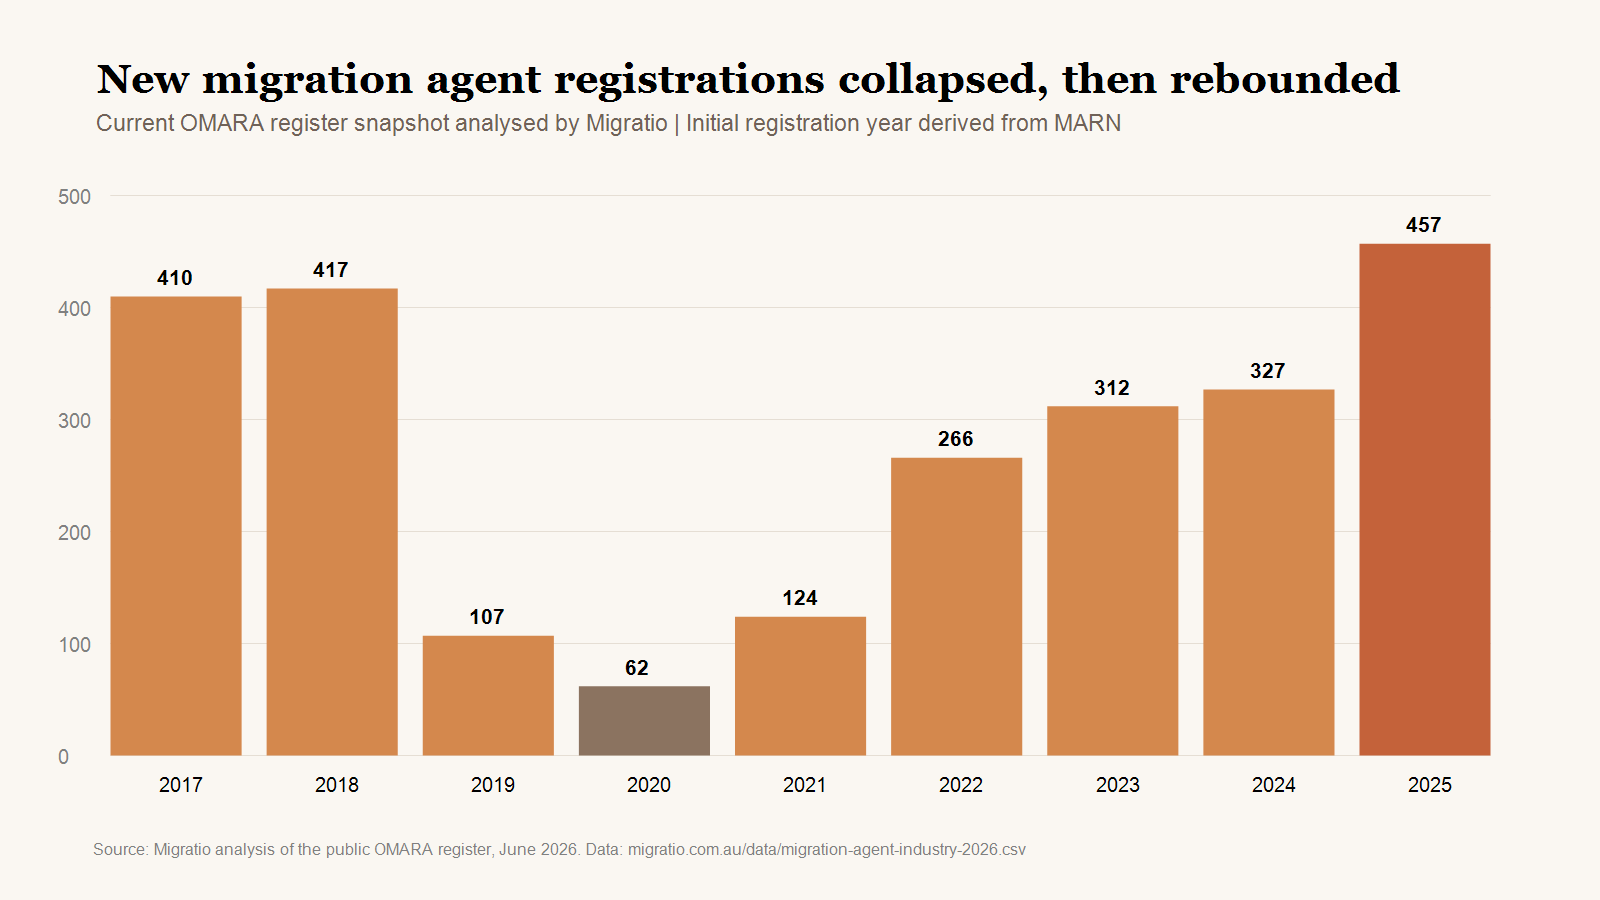
Method: fixed snapshot of 5,489 current OMARA records extracted in June 2026. Registration year is derived from the MARN. The live register and Migratio directory may change after the snapshot date.
Citation: Migratio (2026), The State of Australian Migration Agents in 2026, https://migratio.com.au/blog/state-of-australian-migration-agents-2026
Eleven years of Australian immigration data
- Net overseas migration fell 43.2% from its 2022-23 peak to 305,570 in 2024-25.
- Student visa grants fell 35.6% from the 2022-23 peak to 371,564 in 2024-25.
- Working Holiday Maker grants reached 321,116, 53.6% above 2018-19.
- India accounted for 48,326 permanent Migration Program places in 2024-25, or 26.1% of the program.
Read and cite the study
Download the time-series CSV
Download the top-countries CSV
Download definitions and source notes
Download the 1600 x 900 chart
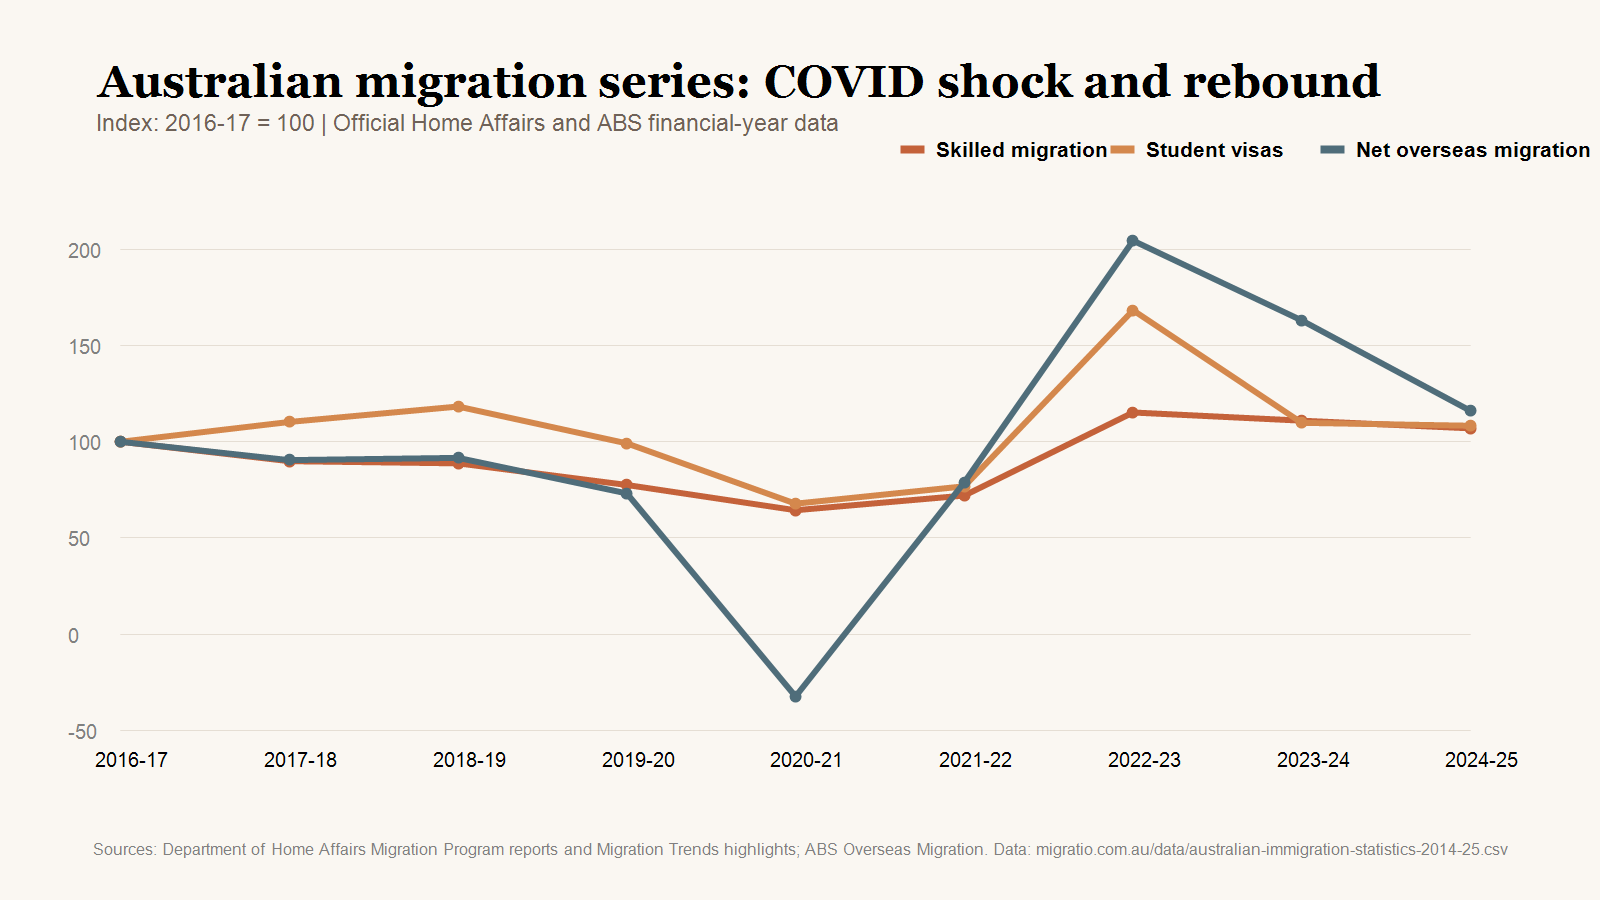
Permanent-program figures are places delivered, temporary categories are visa grants, and ABS net overseas migration is a population measure. These measures should not be added together. Missing values are blank and are not interpolated.
Citation: Migratio (2026), Australian Immigration Statistics: 11 Years of Official Data, https://migratio.com.au/blog/australian-immigration-statistics
Reuse and interviews
Migratio's charts may be republished with a linked attribution to the relevant study. For a custom aggregate cut, a plain-background chart, fact checking or a founder quote, email will@migratio.com.au.